Seaborn 模块
创建于 2024-12-03 /
49
字体:
[默认]
[大]
[更大]
使用 Seaborn 可视化分布
Seaborn 是一个在底层使用 Matplotlib 绘制图形的库。 它将用于可视化随机分布。
安装 Seaborn。
如果您已经在系统上安装了 Python 和 PIP,请使用此安装 命令:
C:UsersYour Name>pip install seaborn如果您使用 Jupyter,请使用以下命令安装 Seaborn:
C:UsersYour Name>!pip install seabornDistplots
Distplot 代表分布图,它以一个数组为输入,绘制一条对应于数组中点分布的曲线。
Import Matplotlib
使用以下语句在代码中导入 Matplotlib 模块的 pyplot 对象: import matplotlib.pyplot as pltImport Seaborn
使用以下语句在您的代码中导入 Seaborn 模块: import seaborn as sns绘制分布图
实例
import matplotlib.pyplot as pltimport seaborn as sns
sns.distplot([0, 1, 2, 3, 4, 5])
plt.show() 亲自试一试 »
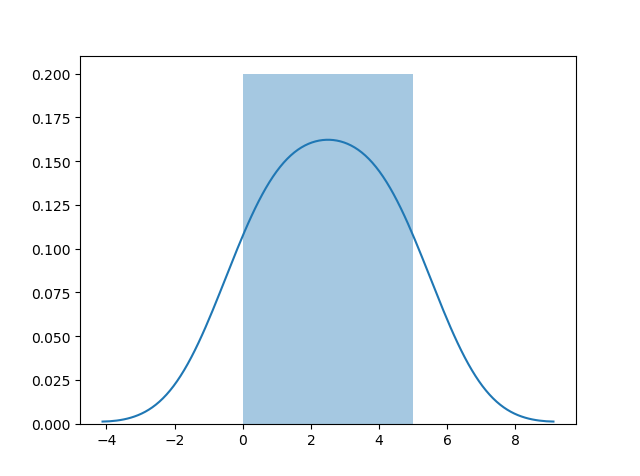
绘制没有直方图的分布图
实例
import matplotlib.pyplot as pltimport seaborn as sns
sns.distplot([0, 1, 2, 3, 4, 5], hist=False)
plt.show() 亲自试一试 »
注释:我们将使用:sns.distplot(arr, hist=False) 在本教程中可视化随机分布。
0 人点赞过